Overview
The Brain eQTL Almanac (Braineac) is a
web-based resource to access the UK Brain Expression
Consortium (UKBEC) dataset. The aim of Braineac
is to release to the scientific community a valid instrument to investigate the
genes and SNPs associated with neurological disorders.
What is
possible with BRAINEAC?
- Visualise
gene expression across the brain
-
SNP acting as cis-eQTL on a selected gene and know
where it's located
- Find if a one or more risk SNPs are operating as a eQTL
and in which brain region
- Download
the expression data by genes or tissue to
develop new methods
A. Visualise
gene expression across the brain
"By Gene" provides the gene expression across ten
brain tissues (CRBL, FCTX, HIPP, MEDU, OCTX, PUTM, SNIG, TCTX, THAL and WHMT).
To obtain the expression follow the next three steps.
1. Select tab "By Gene"
and digit the gene symbol in the box.
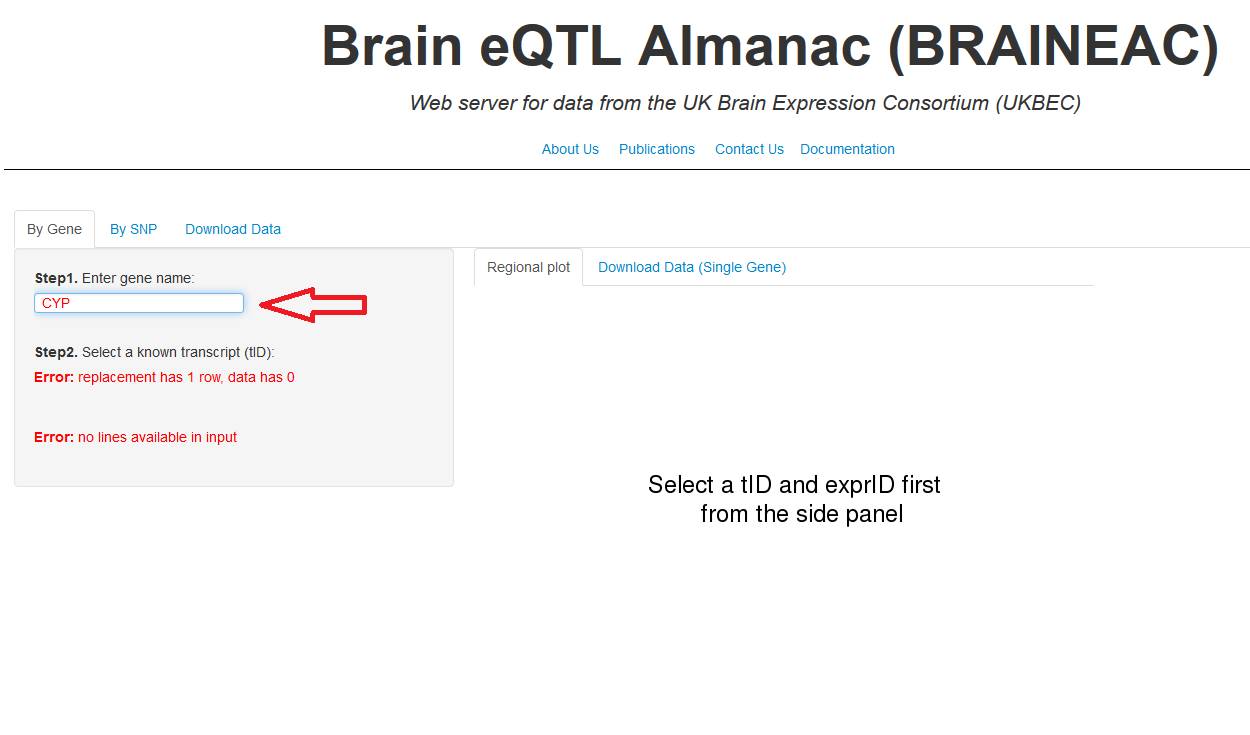
Figure 1
2. A
table will appear underneath showing the transcript ID (tID).
The tID is the transcript cluster ID from Affymetrix Human Exon 1.0 ST. Click
into the row to select the transcript of interest.
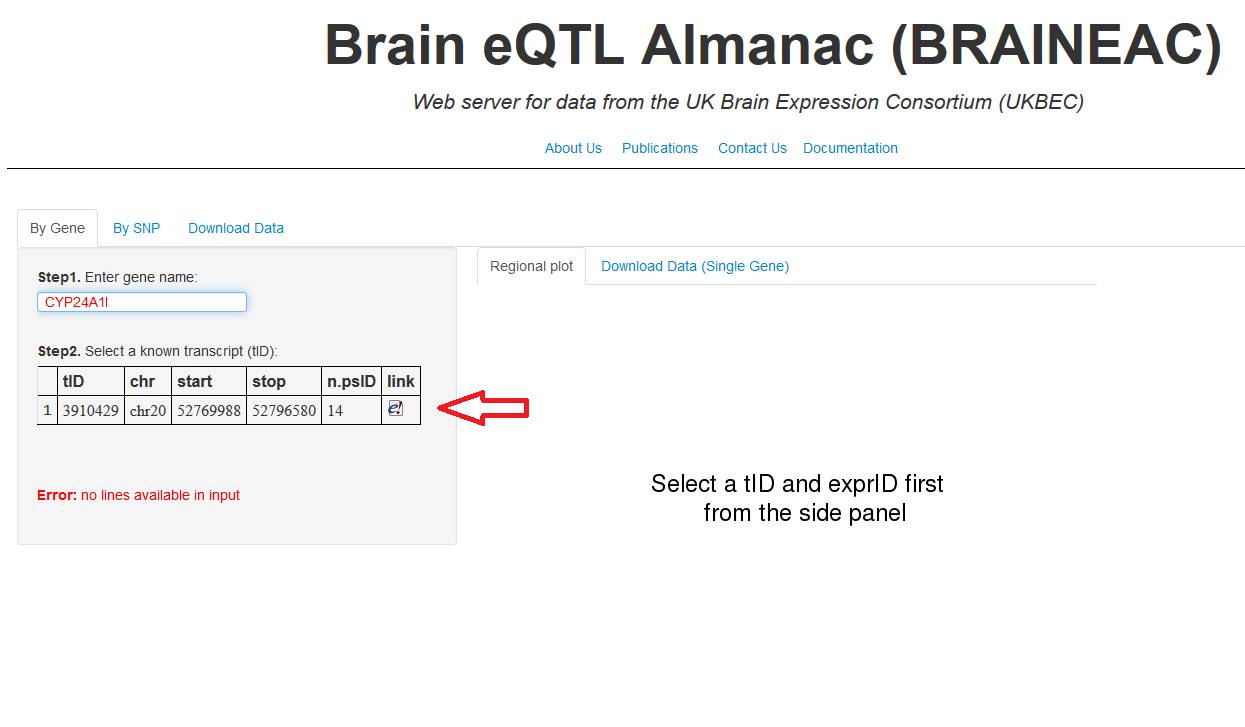
Figure 2
3. A new table is going to show you all the probesets
belonging to the selected tID. Finally, in the same
way as point 2, select the exon-specific probeset (exprID) to visualise
the gene expression, ordered from highest expressed to the lowest expressed.
Note: The exprID of the first row of this table has
always a t in front, it means the expression is
visualise by transcript-level.
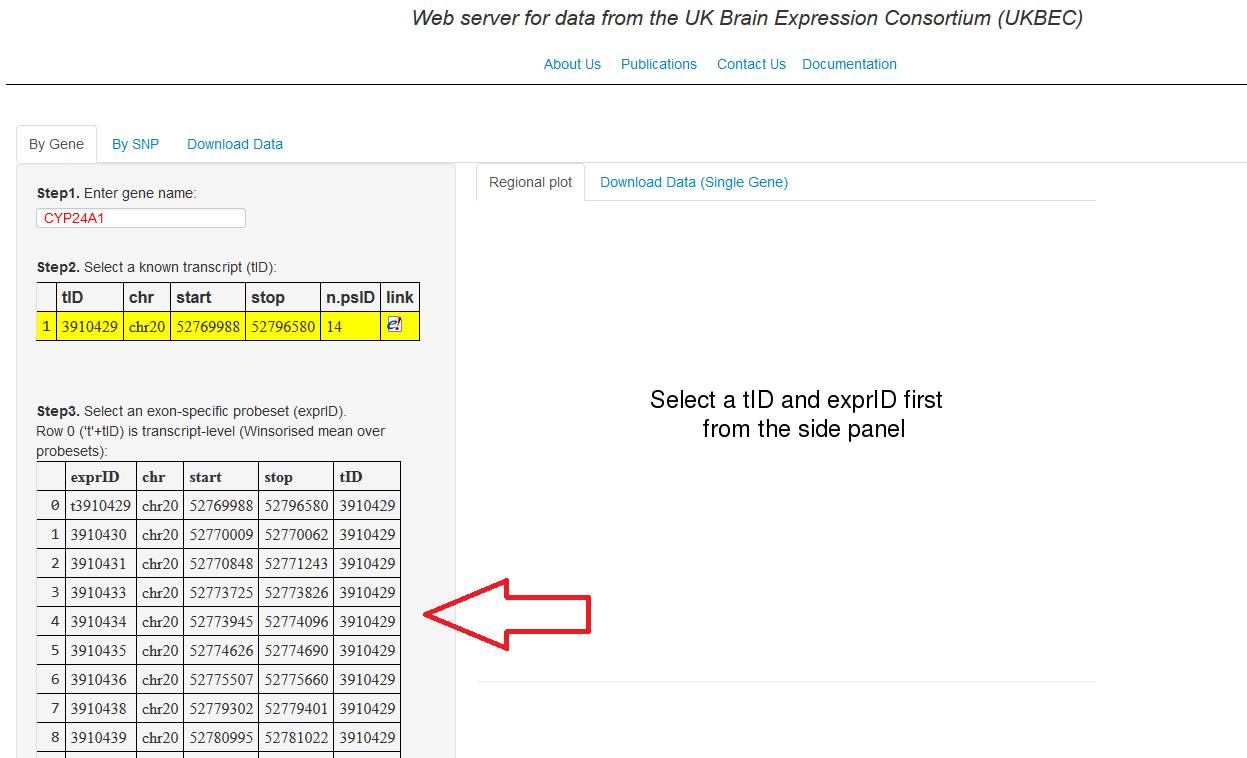
Figure 3
B.
Detect if a SNP is acting on a selected gene
"By SNP" visualise the top ten most
affected genes by SNP and relative p-values. It's also possible download the
full list of genes affected.
4.
Once you visualise the gene expression (section A), insert the SNP ID (rs#...) in the "Stratify expression by SNP" (fig.
4a). A plot with the expression of each SNP by tissue will be visualise below
the input box, it may take up to 20 seconds. If the SNP inserted is acting as cis-eQTL its respective p-value will be in red color (fig. 4b).
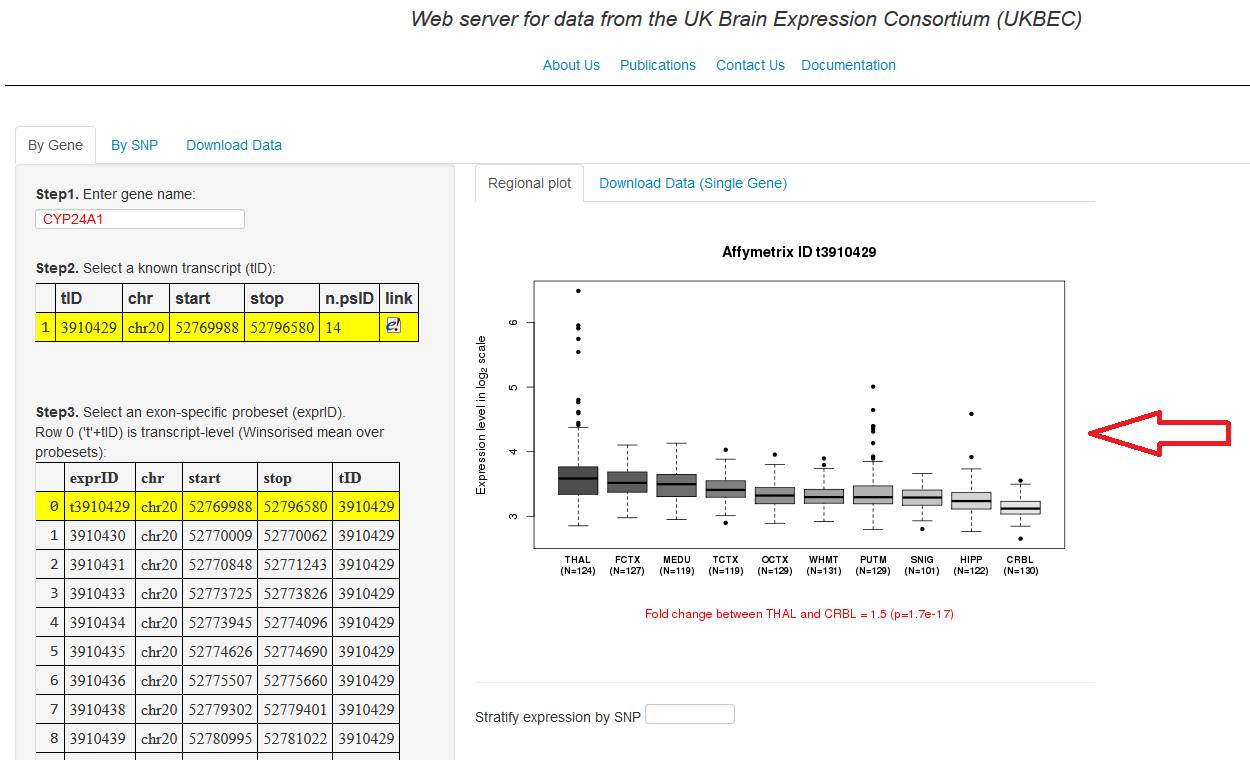
Figure 4a
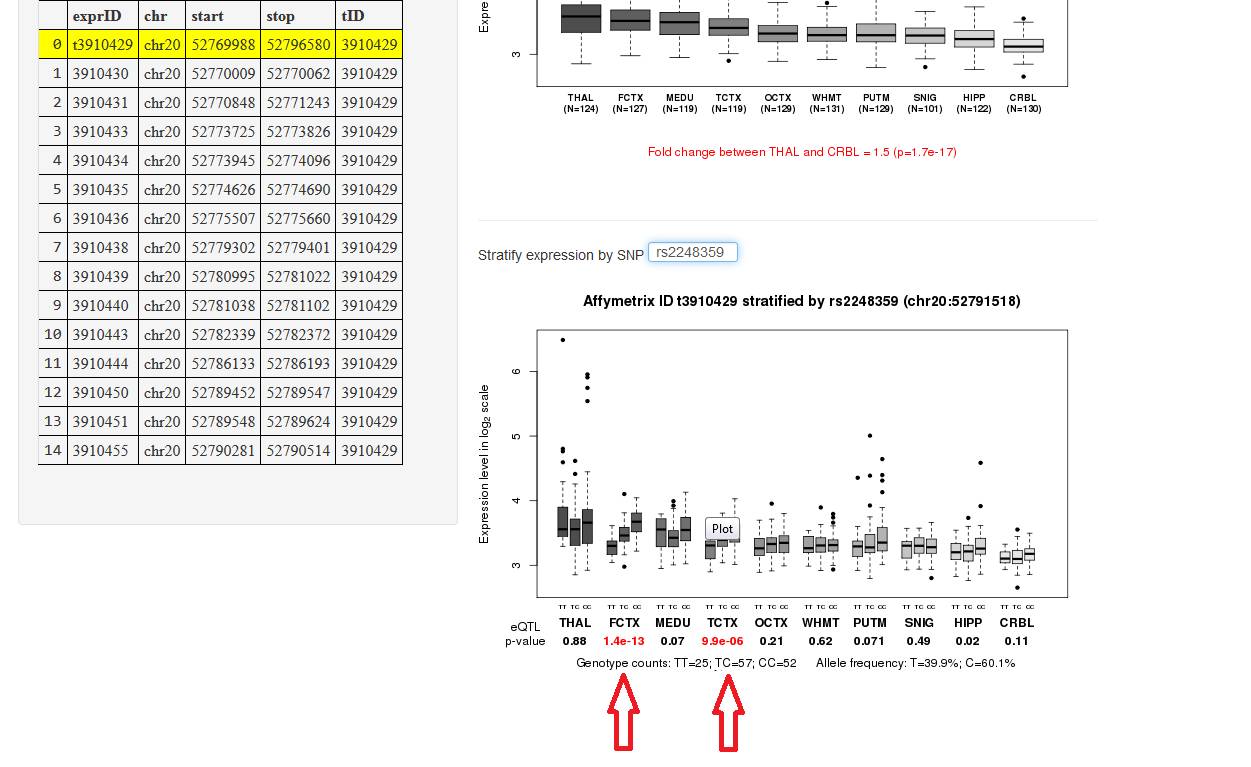
Figure 4b
C.
Find if one or more SNPs are operating as an eQTL
5. Click in the tab "By SNP" and digit the SNP IDs in the textbox,
you can digit one per row up to twenty SNP IDs. Once you have inputed all the SNP IDs press the submit button (fig. 5a). The
results may take up to 60 to be reported. The results (fig. 5b) are composed
by: Line describing how many SNP IDs were entered, a table with the ten most
relevant exprID ordered by most significant p-value
and a click button to download a comma separate file (.csv)
with the entire results (for a full description of the results file, see
"Full cis-eQTL results" section).
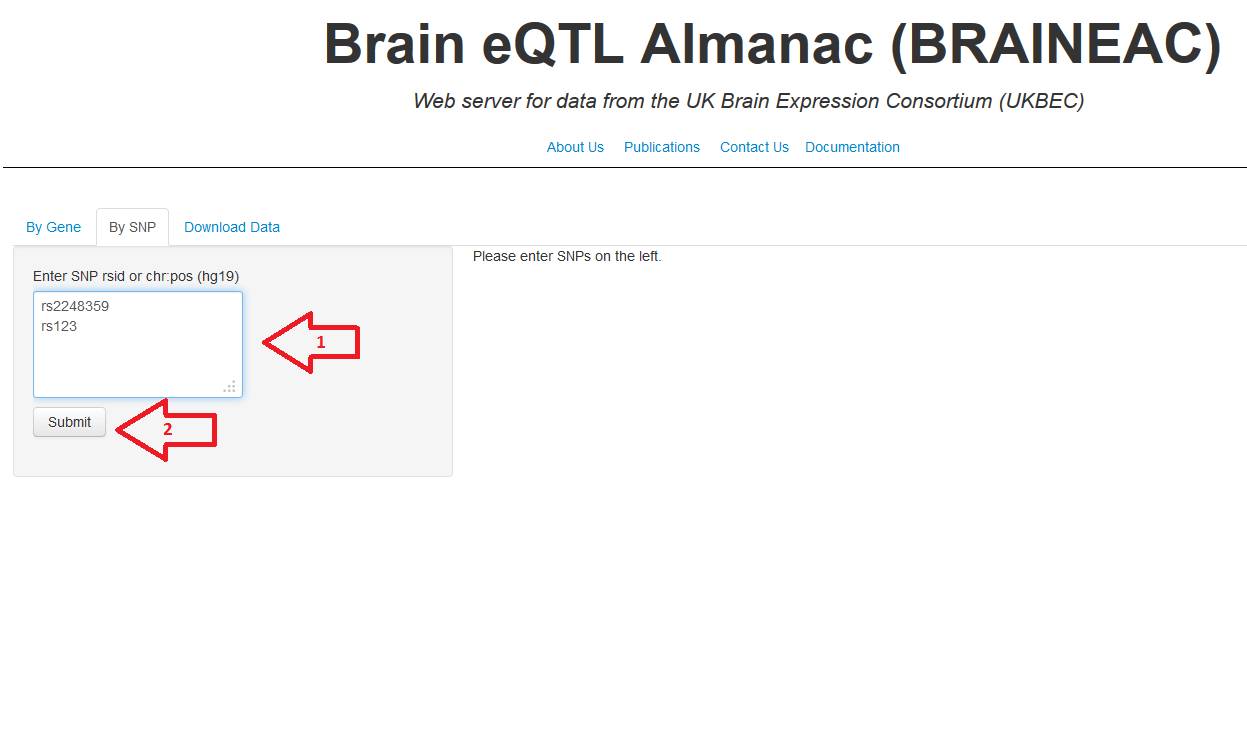
Figure 5a
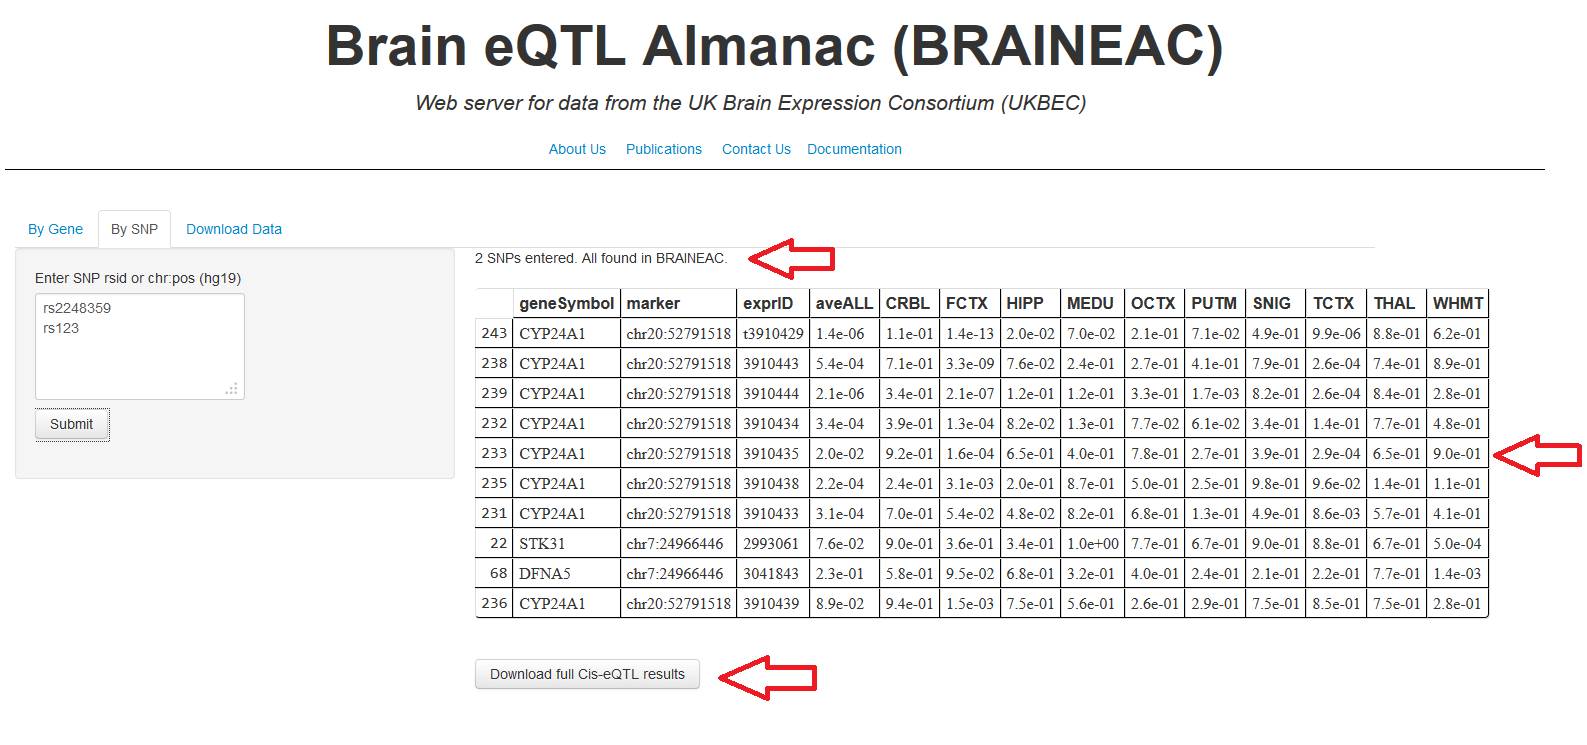
Figure 5b
D. Download
the expression data by single gene to develop new methods
6. click in the tab "By Gene", then
in the right side, click in the tab "Download Data (Single Gene)".
Now, digit the gene of interest and then select the
transcript ID in the table below.
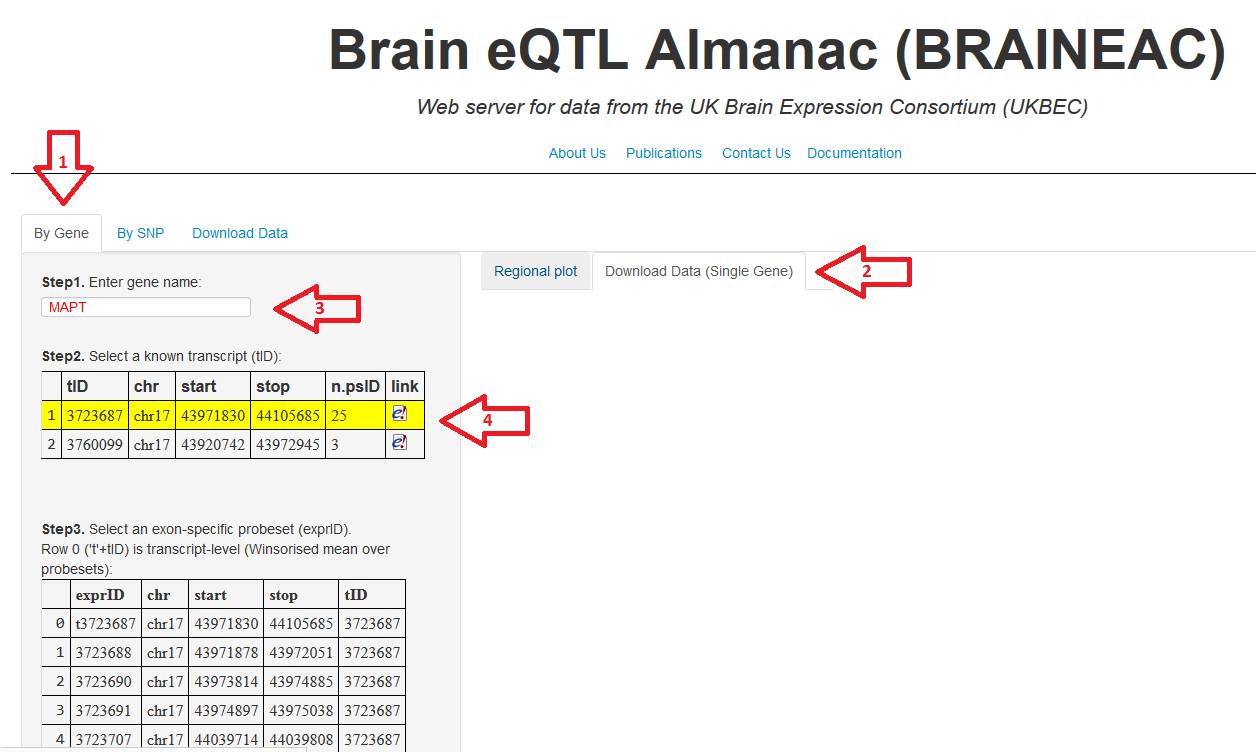
Figure 6
7. Select the file format in the (R data or Excel). In case
you select the Excel format in the step 7, you can also download the file in
two different ways; expression data in a single file or expression data divided
by tissue where each file correspond to a one specific tissue. Press
"Download" button to obtain the file.
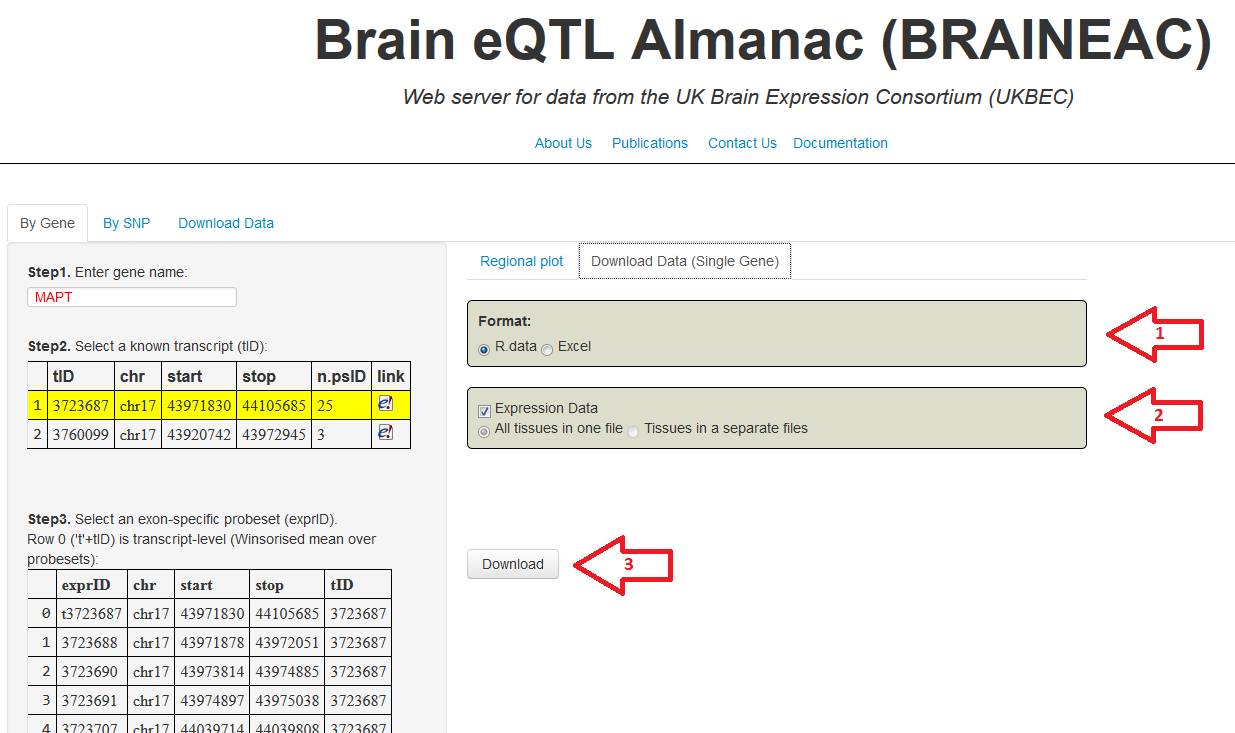
Figure 7
F. Download the
expression data by tissue to develop new method
8. To download the expression data by tissue, select the tab
"Download Data" and then click the link to have the entire expression
data for that specific tissue.
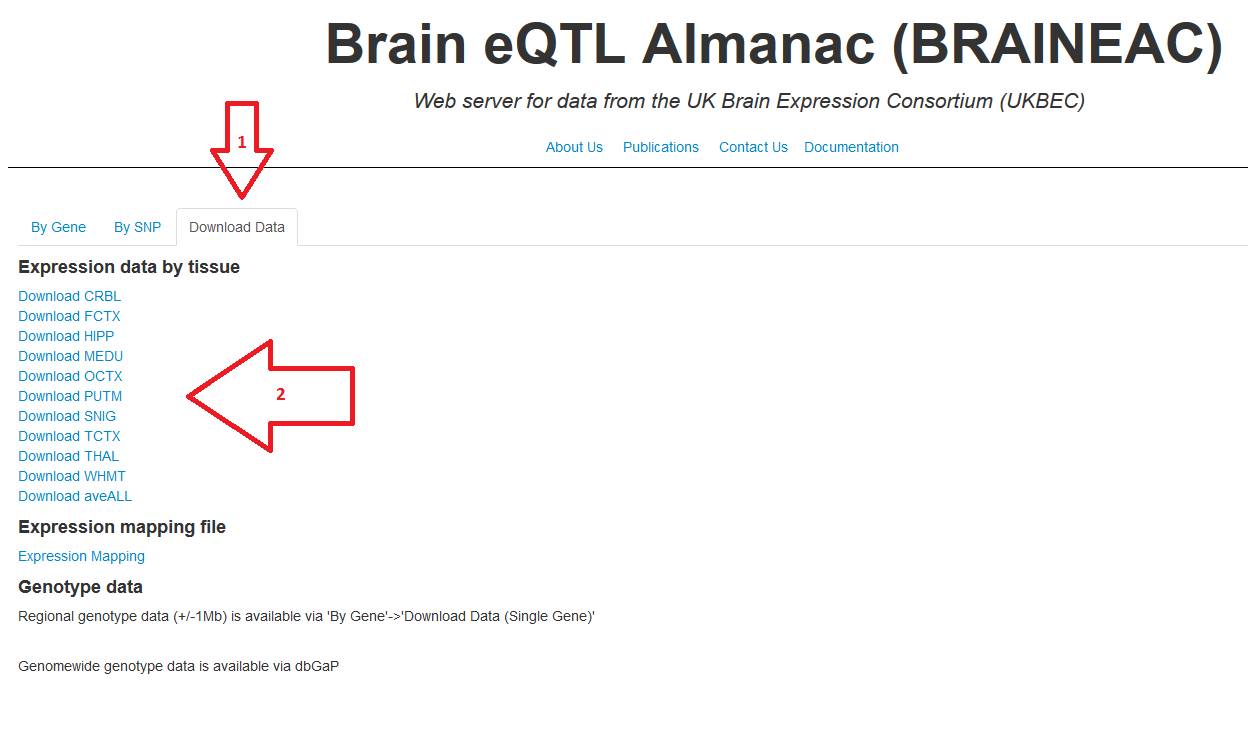
Figure 8
Full cis-eQTL results
Downloading
the full cis-eQTL results, it is possible obtain a csv file containing all the results. The file is composed
by:
-
GeneSymbol - Gene Name
-
marker - position of the SNP inserted
-
rsid - SNP ID
-
exprID - exon-specific probeset affected by the SNP
-
The rest of the columns are the p-value for 10 different tissues plus
the pvalue for aveAll. The aveAll is the expression profile across all the tissues.